By Felipe Morales, CEO of ESBUENISIMO LINKS
Advertising spend in Chile 2026: digital now takes more than half
Advertising spend in Chile 2026: CLP 1 trillion in 2025, digital at 54% and 55.8% so far in 2026. Spend by medium from 2014 to 2025, with AAM data.
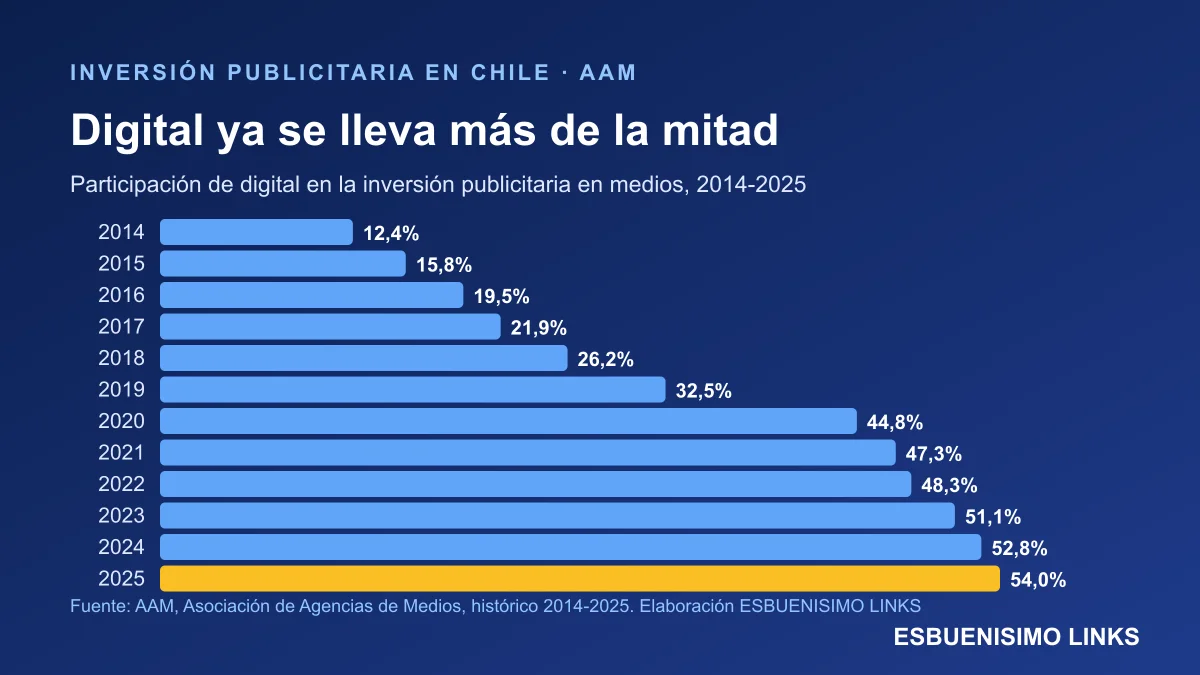
Advertising spend in Chile passed one trillion pesos for the first time in 2025: CLP 1,006,572 million, 4% more than in 2024, according to the historical series of the Chilean Association of Media Agencies (AAM). That is roughly US$1.06 billion at the 2025 average exchange rate. More than half already goes to digital: 54% in 2025, up from 12.4% in 2014. The trend continues in 2026. The latest report, for September, shows digital took 55.8% of spend between January and September, growing 7.7%, while free-to-air TV fell 1.9%.
For a marketing manager, these figures are a benchmark to compare your own media mix with the market's. For communications teams they show something else: news outlets live off a pie that keeps moving to Google, Meta and the platforms, and that changes how brands earn space in them.
View the data as a table
| million pesos invested in media in 2025 (+4% vs. 2024) | 1,006,572 |
| of 2025 spend went to digital (12.4% in 2014) | 54.0% |
| digital share in January-September 2026 | 55.8% |
| million pesos forecast for all of 2026 | 1,066,486 |
Advertising spend in Chile in 2025: the trillion-peso year
AAM figures are net and nominal, excluding agency commission and VAT. They combine actual spend reported by member agencies with Megatime projections for traditional media, and a joint AAM, Admetricks and IAB Chile methodology for digital. It is the longest comparable series in the Chilean market, starting in 2014.
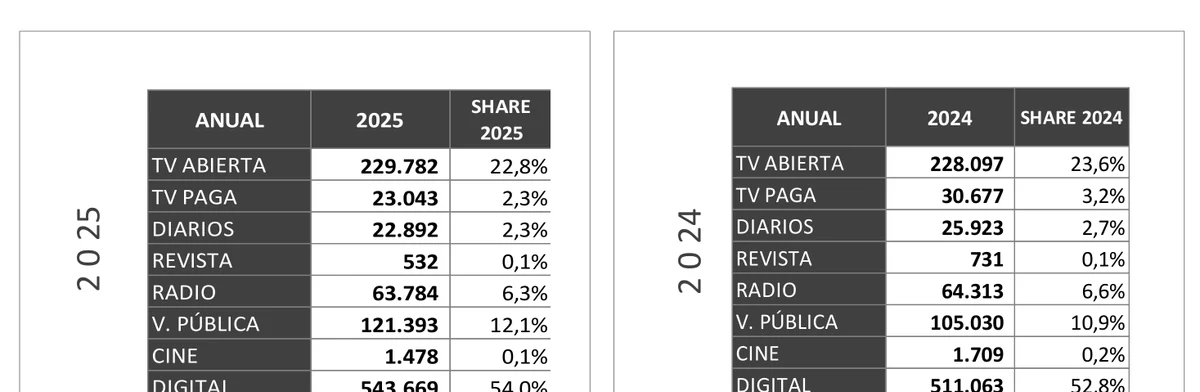
| Medium | 2025 spend (CLP million) | 2025 share | 2014 share | 2025 vs. 2024 |
|---|---|---|---|---|
| Digital | 543,669 | 54.0% | 12.4% | +6.4% |
| Free-to-air TV | 229,782 | 22.8% | 36.9% | +0.7% |
| Out-of-home | 121,393 | 12.1% | 10.3% | +15.6% |
| Radio | 63,784 | 6.3% | 7.7% | -0.8% |
| Pay TV | 23,043 | 2.3% | 9.7% | -24.9% |
| Newspapers | 22,892 | 2.3% | 20.3% | -11.7% |
| Cinema | 1,478 | 0.1% | 0.3% | -13.5% |
| Magazines | 532 | 0.1% | 2.4% | -27.2% |
| Total | 1,006,572 | 100% | 100% | +4.0% |
Three facts stand out from 2025. Out-of-home grew 15.6% to 12.1% of the total, driven by digital screens and programmatic buying. Pay TV fell 24.9% and newspapers 11.7%. And free-to-air TV, at CLP 229,782 million, stayed flat (+0.7%) despite it being a presidential election year.
View the data as a table
| Digital | Free-to-air TV | Out-of-home | Newspapers | Radio | |
|---|---|---|---|---|---|
| 2014 | 81,487 | 242,340 | 67,938 | 133,464 | 50,579 |
| 2015 | 105,376 | 224,469 | 72,681 | 125,791 | 49,477 |
| 2016 | 136,342 | 219,621 | 86,982 | 117,614 | 50,563 |
| 2017 | 157,444 | 227,037 | 78,072 | 114,458 | 54,758 |
| 2018 | 199,438 | 227,535 | 89,844 | 101,107 | 63,527 |
| 2019 | 229,383 | 199,239 | 88,714 | 71,180 | 61,445 |
| 2020 | 274,845 | 180,166 | 42,027 | 30,647 | 45,103 |
| 2021 | 406,482 | 242,080 | 64,791 | 30,461 | 57,100 |
| 2022 | 455,654 | 247,620 | 91,753 | 30,545 | 65,839 |
| 2023 | 498,283 | 239,852 | 100,519 | 26,027 | 67,285 |
| 2024 | 511,063 | 228,097 | 105,030 | 25,923 | 64,313 |
| 2025 | 543,669 | 229,782 | 121,393 | 22,892 | 63,784 |
How advertising spend in Chile has changed since 2014
The twelve-year picture is one of transfer. In 2014 free-to-air TV had 36.9% of the pie and newspapers 20.3%. In 2025 free-to-air TV has 22.8% and newspapers 2.3%. Newspapers went from CLP 133,464 million to CLP 22,892 million, an 83% drop in nominal pesos, before inflation.
View the data as a table
| Digital | Free-to-air TV | Out-of-home | Radio | Newspapers | Pay TV | Magazines | Cinema | |
|---|---|---|---|---|---|---|---|---|
| 2014 | 12.4% | 36.9% | 10.3% | 7.7% | 20.3% | 9.7% | 2.4% | 0.3% |
| 2017 | 21.9% | 31.6% | 10.9% | 7.6% | 15.9% | 10.2% | 1.6% | 0.3% |
| 2019 | 32.5% | 28.3% | 12.6% | 8.7% | 10.1% | 6.7% | 0.8% | 0.3% |
| 2021 | 47.3% | 28.2% | 7.5% | 6.7% | 3.5% | 6.6% | 0.1% | 0.0% |
| 2023 | 51.1% | 24.6% | 10.3% | 6.9% | 2.7% | 4.2% | 0.1% | 0.2% |
| 2025 | 54.0% | 22.8% | 12.1% | 6.3% | 2.3% | 2.3% | 0.1% | 0.1% |
Digital overtook free-to-air TV in 2019 and the pandemic sped up the shift. In 2020 total spend fell 13%, but digital kept rising. In 2021 the market rebounded 39.9% and digital added CLP 131,637 million in a single year. Since 2023 digital has had more than half of the total.
View the data as a table
| 2014 | 2015 | 2016 | 2017 | 2018 | 2019 | 2020 | 2021 | 2022 | 2023 | 2024 | 2025 | |
|---|---|---|---|---|---|---|---|---|---|---|---|---|
| Free-to-air TV | 242,340 | 224,469 | 219,621 | 227,037 | 227,535 | 199,239 | 180,166 | 242,080 | 247,620 | 239,852 | 228,097 | 229,782 |
| Pay TV | 63,437 | 73,177 | 74,365 | 72,993 | 66,093 | 47,356 | 39,294 | 56,833 | 49,542 | 40,774 | 30,677 | 23,043 |
| Newspapers | 133,464 | 125,791 | 117,614 | 114,458 | 101,107 | 71,180 | 30,647 | 30,461 | 30,545 | 26,027 | 25,923 | 22,892 |
| Magazines | 15,503 | 13,410 | 11,858 | 11,809 | 11,993 | 5,600 | 1,376 | 513 | 733 | 689 | 731 | 532 |
| Radio | 50,579 | 49,477 | 50,563 | 54,758 | 63,527 | 61,445 | 45,103 | 57,100 | 65,839 | 67,285 | 64,313 | 63,784 |
| Out-of-home | 67,938 | 72,681 | 86,982 | 78,072 | 89,844 | 88,714 | 42,027 | 64,791 | 91,753 | 100,519 | 105,030 | 121,393 |
| Cinema | 1,662 | 2,462 | 2,682 | 2,270 | 2,293 | 2,351 | 286 | 334 | 798 | 2,126 | 1,709 | 1,478 |
| Digital | 81,487 | 105,376 | 136,342 | 157,444 | 199,438 | 229,383 | 274,845 | 406,482 | 455,654 | 498,283 | 511,063 | 543,669 |
🚀 Digital PR & Link Building
Rank #1 on Google and Get Mentioned by AI
1,400+ media outlets in 8 countries. Backlinks that Google and ChatGPT recognize as trusted authority sources.
See plans and pricing →The other media: winners and losers
Beyond digital and free-to-air TV, the map also changed. Out-of-home is the big winner among traditional media: it went from CLP 67,938 million in 2014 to CLP 121,393 million in 2025, a 79% nominal increase, and is now well ahead of radio. Radio has been steadier than the rest: it grew 26% in nominal pesos since 2014 and keeps about 6% of the pie, which fits the high trust radio stations get in surveys.
The biggest losers are print and pay TV. Magazines fell from CLP 15,503 million to CLP 532 million, a 97% drop: they are now almost symbolic. Pay TV fell 64% since 2014 and 51% since 2019, in line with audiences moving to streaming. Cinema, after nearly disappearing in 2020 and 2021, remains small: 0.1% of the total in 2025.
These figures should be read for what they are: nominal pesos, before inflation. A medium that grows less than the consumer price index is actually losing purchasing power. That is why AAM also publishes real change: for 2026 it forecasts 6% nominal growth, but only 1.7% after expected inflation.
How to use these figures in your budget
This data does not tell you how much a brand should spend, but it works as a reference. If your mix puts much less than half into digital, you are below the market average; if almost everything goes to paid search and social ads, you depend on a channel that gets more expensive with every campaign. A useful question for the next budget is which part of the spend leaves something that lasts: content, organic Google rankings or media mentions that keep working after the campaign ends.
Advertising spend in 2026 so far
Between January and September 2026, CLP 733,683 million was invested, 4.9% more than in the same period of 2025. Note a change in method: since the July 2026 report, AAM separates retail media (ads inside retailer sites and apps such as Falabella or Mercado Libre) from digital and out-of-home, and restated 2025 on that basis. Under the new method, 2025 closes at CLP 988,814 million.
| Medium | Share Jan-Sep 2026 | Change vs. Jan-Sep 2025 | AAM 2026 forecast share |
|---|---|---|---|
| Digital | 55.8% | +7.7% | 54.7% |
| Free-to-air TV | 22.3% | -1.9% | 22.4% |
| Out-of-home | 11.1% | +10.2% | 12.8% |
| Radio | 6.3% | +2.4% | 5.8% |
| 2.1% | -3.1% | about 2% | |
| Pay TV | 2.1% | -3.6% | about 2% |
In August, AAM forecast that 2026 would close at CLP 1,066,486 million, a nominal increase of about 6% and 1.7% in real terms, according to its forecast published by AMDD. Among the trends it identifies are "more intensive use of data, CRM, SEO and platforms", the growth of retail media and more focus on conversion. By sector, it sees more activity in retail, consumer goods, technology and health, and cutbacks in automotive, alcohol and regulated categories.
- 2014Digital is 12.4% of the pieFree-to-air TV has 36.9% and newspapers 20.3%.
- 2019Digital overtakes free-to-air TV229,383 vs. 199,239 million pesos.
- 2020The pandemic cuts spend by 13%Total of 613,745 million; out-of-home falls by more than half.
- 2021A 39.9% reboundDigital rises from 274,845 to 406,482 million.
- 2023Digital passes 50%51.1% of total spend.
- 2025Over one trillion pesos1,006,572 million; digital reaches 54%.
- 2026Digital at 55.8% through SeptemberAAM forecasts 1,066,486 million for the year.
What it means for marketing and communications
If more than half of spend goes to digital, the question is no longer whether to be in digital but in which part. Most of that pie is bought on Google and Meta, where cost per click rises every year; we measured it in the most expensive Google Ads keywords in Chile. When the campaign stops, the traffic stops with it.
News outlets, meanwhile, are losing traditional ad revenue (newspapers down 83% in twelve years) and looking for other income. That is why paid content formats have grown, such as the native advertising article and the sponsored story. For a brand, a linked story in an authoritative outlet has two effects an ad does not: it stays published, and it adds signals for Google and for the AI tools that read those outlets.
That is the logic of media link building: putting part of the digital budget into assets that last. At ESBUENISIMO LINKS you can compare more than 1,400 outlets and buy linked placements in Chilean digital media, and measure whether your brand shows up in ChatGPT or Gemini with our GEO agency. To see how spend splits across content formats, read our guide to digital media advertising.
| 2014 | 81,487 | 242,340 | 67,938 | 50,579 | 133,464 | 63,437 | 15,503 | 1,662 | 656,410 |
| 2015 | 105,376 | 224,469 | 72,681 | 49,477 | 125,791 | 73,177 | 13,410 | 2,462 | 666,842 |
| 2016 | 136,342 | 219,621 | 86,982 | 50,563 | 117,614 | 74,365 | 11,858 | 2,682 | 700,027 |
| 2017 | 157,444 | 227,037 | 78,072 | 54,758 | 114,458 | 72,993 | 11,809 | 2,270 | 718,840 |
| 2018 | 199,438 | 227,535 | 89,844 | 63,527 | 101,107 | 66,093 | 11,993 | 2,293 | 761,831 |
| 2019 | 229,383 | 199,239 | 88,714 | 61,445 | 71,180 | 47,356 | 5,600 | 2,351 | 705,268 |
| 2020 | 274,845 | 180,166 | 42,027 | 45,103 | 30,647 | 39,294 | 1,376 | 286 | 613,745 |
| 2021 | 406,482 | 242,080 | 64,791 | 57,100 | 30,461 | 56,833 | 513 | 334 | 858,594 |
| 2022 | 455,654 | 247,620 | 91,753 | 65,839 | 30,545 | 49,542 | 733 | 798 | 942,484 |
| 2023 | 498,283 | 239,852 | 100,519 | 67,285 | 26,027 | 40,774 | 689 | 2,126 | 975,554 |
| 2024 | 511,063 | 228,097 | 105,030 | 64,313 | 25,923 | 30,677 | 731 | 1,709 | 967,543 |
| 2025 | 543,669 | 229,782 | 121,393 | 63,784 | 22,892 | 23,043 | 532 | 1,478 | 1,006,572 |
Methodology: figures from the Chilean Association of Media Agencies (AAM), in million nominal net Chilean pesos, excluding agency commission and VAT. 2014-2025 history from the May 2026 report (before retail media was separated). 2026 data from the September 2026 report, published November 11, 2026, under the new method. AAM 2026 forecast published August 28, 2026. US dollar conversion uses the 2025 average rate in the AAM report (CLP 951.27).
Frequently Asked Questions
How much is spent on advertising in Chile?+
In 2025, media advertising spend reached CLP 1,006,572 million net, according to AAM, 4% more than in 2024. Between January and September 2026 CLP 733,683 million was invested, and AAM forecasts CLP 1,066,486 million for all of 2026.
What share of advertising spend is digital in Chile?+
54% in 2025 and 55.8% between January and September 2026. In 2014 digital was only 12.4% of the pie; it overtook free-to-air TV in 2019 and passed 50% in 2023.
Which medium gets the most spend after digital?+
Free-to-air TV, with CLP 229,782 million in 2025 (22.8% of the total). It is followed by out-of-home, with CLP 121,393 million (12.1%), the fastest-growing traditional medium.
How much has newspaper advertising fallen in Chile?+
Newspapers went from CLP 133,464 million in 2014 to CLP 22,892 million in 2025, an 83% drop in nominal pesos. Their share fell from 20.3% to 2.3%.
Who measures advertising spend in Chile?+
The Chilean Association of Media Agencies (AAM) has published a monthly report since 2014 with actual spend by member agencies, projected to the total market with Megatime for traditional media and with Admetricks and IAB Chile for digital.
Ready to rank #1 and get mentioned by AI?
Digital PR & Link Building in 1,400+ media outlets across 8 countries. Google and ChatGPT recognize you as an authority source.
See plans and pricing