By Felipe Morales, CEO of ESBUENISIMO LINKS
Market research: what it is, types, how to do it and an example with Google data
Market research step by step: what it is, its types, free data sources, a real example using Google searches for electric mobility in Chile and how to bring AI into the analysis.
Market research is the investigation that answers three questions before you invest: how many people need what you sell, who else is selling it to them and why they would choose you. It can be a survey with thousands of respondents or an afternoon of analysis with public data. What matters is that the decision is based on evidence, not intuition.
This guide explains what market research is, its types, how to run a study step by step with free sources from Chile, and a real example using Google search data: the electric mobility market. We also show how to bring artificial intelligence into the analysis, because part of the competition now plays out in what ChatGPT and Gemini answer.
What market research is and what it's for
It is the structured collection and analysis of data about customers, competitors and the environment of a market. It helps you launch a product, enter a country, set prices, choose channels or decide how much to invest in marketing. It is a large industry: according to ESOMAR, the global industry association, the market research and insights industry passed US$150 billion in 2024, and research software already earns more than traditional services (ESOMAR, Research World).
Interest is high too. “Market research” gets 9,900 searches a month in the United States, and the Spanish “estudio de mercado” gets 590 in Chile and 6,600 in Mexico.
View the data as a table
| Mexico | 6,600 |
| Peru | 1,600 |
| Chile | 590 |
| Argentina | 480 |
Types of research: which one you need
| Type | What it answers | How it's done | When to use it |
|---|---|---|---|
| Secondary | What is already known about the market? | Census, public statistics, industry reports, published studies | Always first: fast and cheap |
| Digital demand | How many people search for this, and when? | Google Ads volumes, Google Trends, marketplace searches | To size interest and seasonality |
| Quantitative | How many and what percentage? | Surveys with a representative sample | To validate price, purchase intent or share |
| Qualitative | Why do people buy or not buy? | In-depth interviews, focus groups | To understand motives and customer language |
| Competitive | Who else sells and how? | Website reviews, public prices, search results, AI answers | Before launching or when defining the offer |
A mid-sized company rarely needs all five. The usual path is to start with secondary and digital demand research, which cost almost nothing, and pay for a survey or interviews only for the questions left open. Public sources cover population and business counts reasonably well; what they rarely show is purchase intent, and that is the gap search data fills.
🚀 Digital PR & Link Building
Rank #1 on Google and Get Mentioned by AI
1,400+ media outlets in 8 countries. Backlinks that Google and ChatGPT recognize as trusted authority sources.
See plans and pricing →How to do market research step by step
- Define the decision. Not “understand the market,” but “decide whether to open in Concepción” or “choose between two prices.”
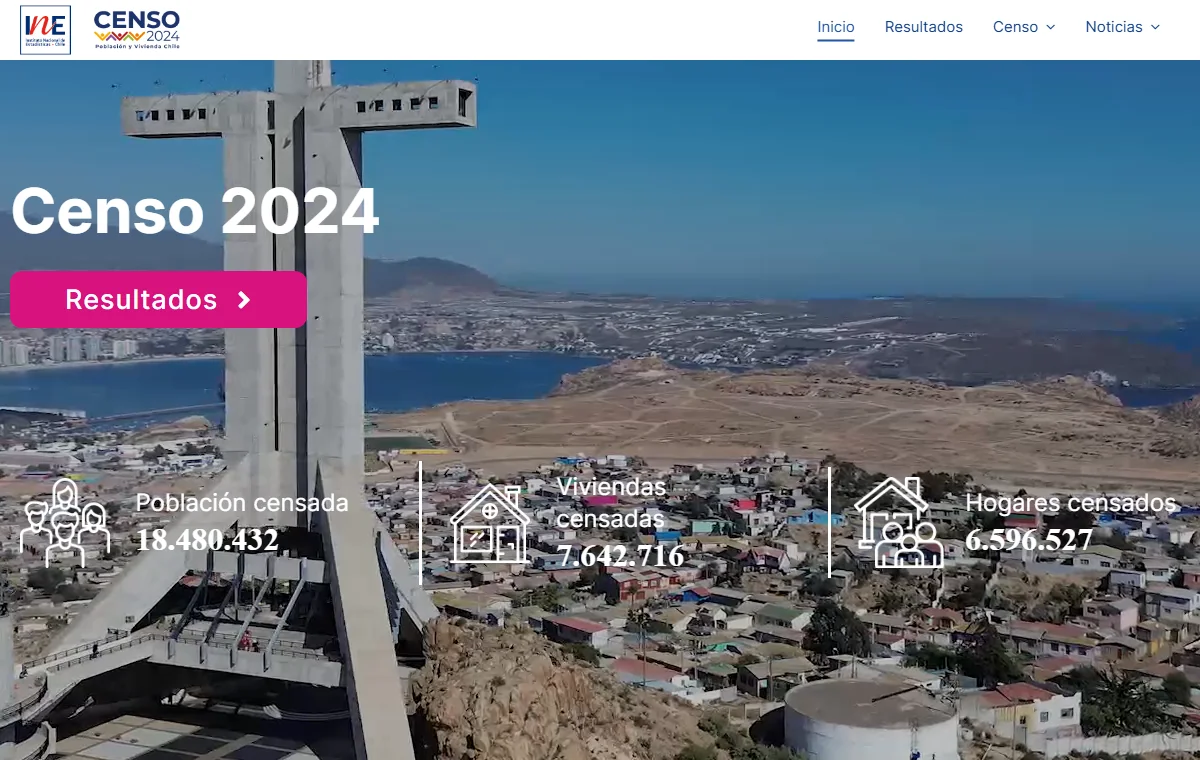
- Size it with public data. In Chile, the INE's 2024 Census is the baseline: 18,480,432 people and 6,596,527 households counted (INE, 2024 Census). Add Central Bank statistics, the tax service's figures by industry and reports from trade groups such as the Santiago Chamber of Commerce.
- Measure digital demand. Google search volumes show how many people search for your category, in which months and with which words.
- Map the competition. Who shows up on Google, with what public prices, and what AI answers when you ask about your category.
- Talk to customers. Ten good interviews explain more than a hundred answers to a badly designed survey.
- Write the conclusion on one page: size, seasonality, competitors, opportunity and the recommendation.
View the data as a table
| people counted | 18,480,432 |
| households counted | 6,596,527 |
| dwellings counted | 7,642,716 |
A market research example with Google data
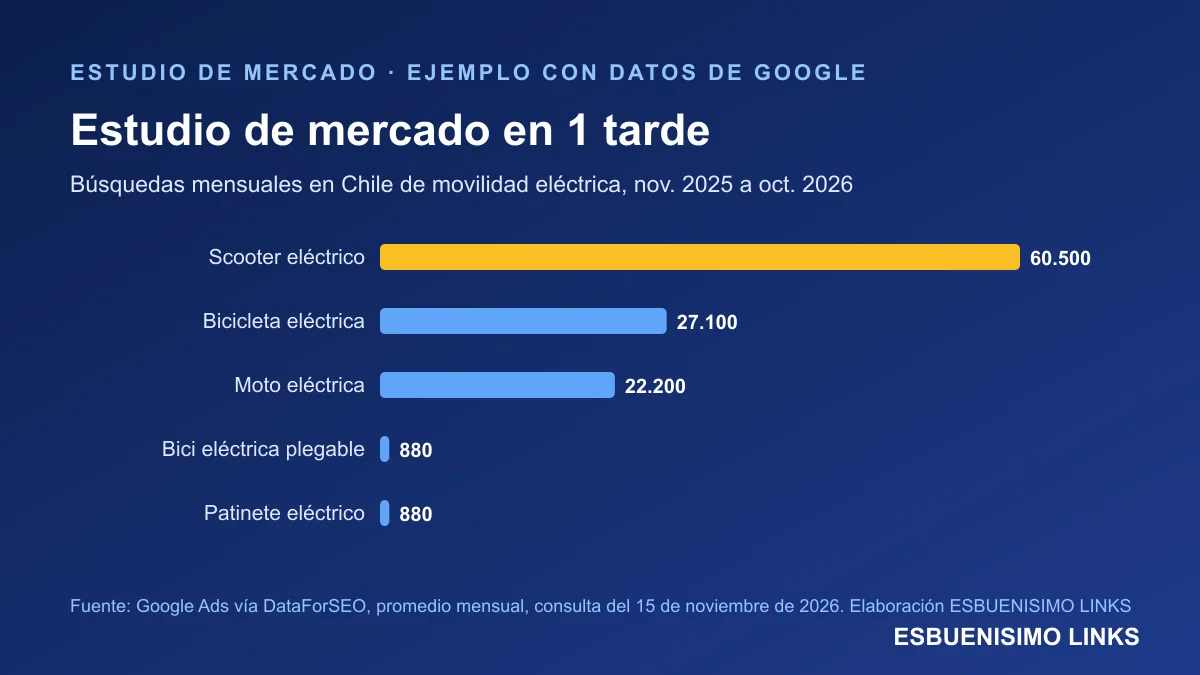
To illustrate step 3, we pulled Google Ads search volumes, via DataForSEO, for electric mobility in Chile between November 2025 and October 2026. It takes minutes and already answers business questions:
| Google Chile search | Monthly average | Peak month | Lowest month |
|---|---|---|---|
| scooter eléctrico (e-scooter) | 60,500 | Dec 2025 (90,500) | Jul 2026 (33,100) |
| bicicleta eléctrica (e-bike) | 27,100 | Mar 2026 (40,500) | Feb 2026 (18,100) |
| moto eléctrica (e-motorbike) | 22,200 | Mar 2026 (33,100) | Feb 2026 (14,800) |
| bicicleta eléctrica plegable (folding e-bike) | 880 | Mar 2026 (1,300) | Jul 2026 (590) |
| bicicleta eléctrica oferta (e-bike deal) | 880 | Oct 2026 (1,300) | Feb 2026 (590) |
| patinete eléctrico (kick scooter) | 880 | Dec 2025 (1,900) | May 2026 (590) |
| kit bicicleta eléctrica (e-bike kit) | 590 | Mar 2026 (720) | Nov 2025 (390) |
View the data as a table
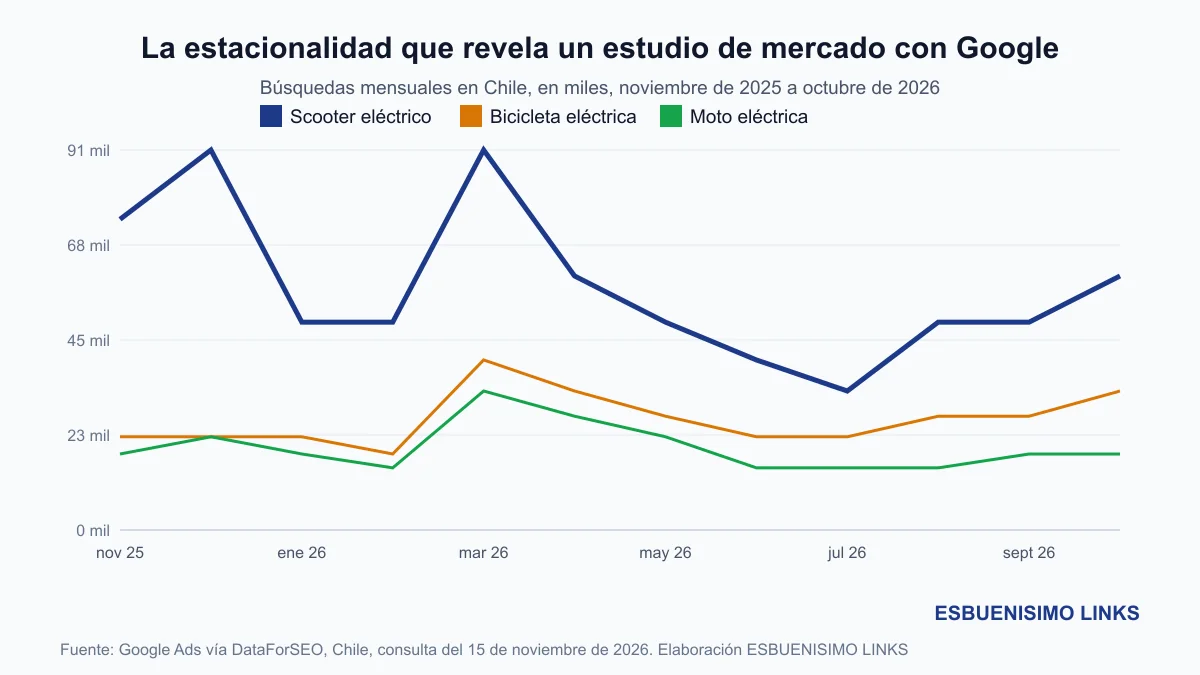
| scooter eléctrico (e-scooter) | bicicleta eléctrica (e-bike) | moto eléctrica (e-motorbike) | |
|---|---|---|---|
| Nov 25 | 74,000 | 22,200 | 18,100 |
| Dec 25 | 90,500 | 22,200 | 22,200 |
| Jan 26 | 49,500 | 22,200 | 18,100 |
| Feb 26 | 49,500 | 18,100 | 14,800 |
| Mar 26 | 90,500 | 40,500 | 33,100 |
| Apr 26 | 60,500 | 33,100 | 27,100 |
| May 26 | 49,500 | 27,100 | 22,200 |
| Jun 26 | 40,500 | 22,200 | 14,800 |
| Jul 26 | 33,100 | 22,200 | 14,800 |
| Aug 26 | 49,500 | 27,100 | 14,800 |
| Sep 26 | 49,500 | 27,100 | 18,100 |
| Oct 26 | 60,500 | 33,100 | 18,100 |
Three takeaways for an importer or a retailer. First, relative size: “scooter eléctrico” is searched more than twice as often as “bicicleta eléctrica” (60,500 versus 27,100 a month on average). Second, seasonality: everything rises in March, when school and work resume after the summer, and scooters have a second peak in December, for Christmas; that is when stock and ad budget matter. Third, language: almost nobody in Chile says “patinete,” so a product page using that word loses traffic. One technical caveat: Google groups singular and plural, so “bicicleta eléctrica” and “bicicletas eléctricas” should not be added up.
This is the same method we used in studies such as Chile's most searched online stores, and it pairs well with share of search, which compares how much of the search demand each brand captures.
How to bring AI into the analysis
There are two different uses. The first is using ChatGPT or Gemini as an assistant: organizing interviews, summarizing reports or drafting survey questions. It helps, but its figures must always be checked against the original source, because it sometimes makes them up.
The second use is more strategic: treat AI as a channel you need to study. Ask it which brands it recommends in your category, which sources it cites and how it describes your company. In our studies, AI tools cite mostly third-party sites (comparison sites, media, lists), and the brands those sites name are the ones that appear in the answers. If your brand doesn't show up, the finding is clear: you lack presence in the sources AI reads. That is what an AI visibility strategy is for, and link building in Chile earns those press mentions and links. Both can be measured before and after, like any other variable in the study.
A simple method for this part: write a list of 20 questions a real customer would ask (“which e-bike is best for commuting in Santiago?”), run them in ChatGPT, Gemini and Google AI Mode, and log in a spreadsheet which brands appear, in what order and which sites are cited. Repeat the same list every month. By the third month you will have a series showing whether your brand is gaining or losing ground against competitors, something no traditional survey measures.
Common mistakes
- Starting with a survey without checking what is already published.
- Asking “would you buy it?”: stated intent almost always overstates real purchases.
- Ignoring seasonality and measuring a single month.
- Looking only at direct competitors and not at substitutes, like scooters versus bikes in the example.
- Not connecting the study to the purchase path. The customer journey tells you when to use each finding.
Good market research doesn't have to be expensive. It has to answer a concrete decision with data anyone can check.
Frequently Asked Questions
What is market research?+
It is the investigation that gathers and analyzes data about customers, competitors and the environment to make a business decision, such as launching a product, setting a price or entering a new city.
What are the types of market research?+
The main ones are secondary (already published data), digital demand (Google searches), quantitative (surveys), qualitative (interviews and focus groups) and competitive research.
How do you do market research step by step?+
Define the decision, size the market with public data such as the census, measure demand with Google searches, map competitors on Google and in AI tools, interview customers and summarize the conclusion on one page.
Can you do market research for free?+
Largely, yes. Census data, central bank and tax statistics, Google Trends and trade association reports are free. Representative surveys are what usually cost money.
Can ChatGPT do market research?+
It can help organize information and draft questions, but its figures must be checked against the original source. It is also worth studying which brands AI recommends in your category, because that is now a competitive channel.
Ready to rank #1 and get mentioned by AI?
Digital PR & Link Building in 1,400+ media outlets across 8 countries. Google and ChatGPT recognize you as an authority source.
See plans and pricing